Data Visualization Archives - gettectonic.com
Financial Services Cloud and Core

Financial Services Cloud and Core

Remember When Salesforce First Launched Financial Services Cloud in 2016? The managed package introduced a standardized data model that transformed how banks, credit unions, and implementation partners utilized Salesforce. It was a game-changer! But Salesforce hasn’t stopped innovating. Since 2019, they’ve been enhancing the core platform to meet demands for greater performance and flexibility. Now,

Read More
Connected Vehicles

Connected Vehicles

Revolutionizing the Automotive Industry: Salesforce’s Connected Car App The automotive industry has always been a beacon of innovation, consistently pushing the boundaries to enhance the driving experience. From the iconic Model T and the assembly line to today’s electric and autonomous vehicles, the evolution of automobiles has been driven by an unyielding pursuit of progress.

Read More
Pulse for Salesforce

Pulse for Salesforce

Salesforce Unveils Pulse for Salesforce: Integrating Tableau Analytics with CRM to Revolutionize Data-Driven Decision-Making In today’s data heavy business world, where data-driven decision-making is essential for success, the fusion of advanced analytics with customer relationship management (CRM) systems is more crucial than ever. Addressing this need, Salesforce has introduced Pulse for Salesforce, a groundbreaking tool

Read More
Salesforce and the Connected Car

Salesforce and the Connected Car

The concept of the Connected Car has been a topic of discussion for years, often accompanied by ambitious predictions from consultants about its market potential. For example, McKinsey in 2021 projected that by 2030, Connected Cars would constitute 95% of all vehicles on the road. Central to the success of these vehicles is data, with

Read More
Salesforce on AI

Salesforce on AI

Marketing success hinges on delivering consistent, timely, and engaging content. According to the Salesforce State of Marketing report, 78% of high-performing marketers identify data as their most critical asset for creating cohesive customer journeys. Yet, only 49% report having a unified view of customer data sources. This disconnect highlights a significant challenge many marketing teams

Read More
Leeds and Other Heatmap Solutions

Leeds and Other Heatmap Solutions

With over 80% of people shopping online – and the numbers are bound to rise – it’s important to know how your would-be customers behave on your website: where they click, how they scroll, and what motivates them to take specific actions. Heatmap analytics does it, allowing you to dominate CRO and UX through effective behavior data

Read More
Generative AI for Tableau

Generative AI for Tableau

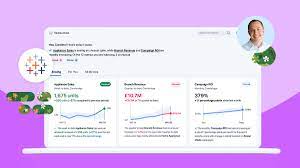
Tableau’s first generative AI assistant is now generally available. Generative AI for Tableau brings data prep to the masses. Earlier this month, Tableau launched its second platform update of 2024, announcing that its first two GenAI assistants would be available by the end of July, with a third set for release in August. The first

Read More
Democratize Data with Einstein Copilot for Tableau

Democratize Data with Einstein Copilot for Tableau

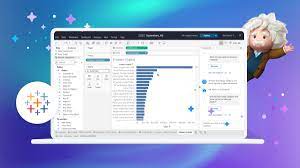
Most workers today recognize the importance of rich data analytics in their jobs. However, 33% struggle to understand and generate insights from data. To address this, Salesforce has introduced Einstein Copilot for Tableau, which allows users of all skill levels to create complex data visualizations without extensive learning or coding. Democratize Data with Einstein Copilot

Read More

AI Agents

Lessons Learned in the First Year of Developing AI Agents In the first year of working on AI agents, valuable insights emerged from direct collaboration with engineers and UX designers, as they iterated on the overall product experience. The objective was to create a platform for customers to use standard data analysis agents and build

Read More
Trust Einstein Copilot for Tableau

Trust Einstein Copilot for Tableau

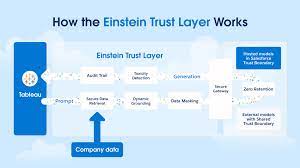
Are you prepared to utilize the capabilities of Einstein Copilot to expand your organization’s analytical advantages? This robust tool facilitates data exploration, insights generation, and visualization development at an unprecedented pace. However, before immersing yourself in its capabilities, it’s crucial to grasp how Einstein Copilot upholds Tableau and Salesforce’s core value: Trust. Let’s discover how

Read More
AI Hallucinations

AI Hallucinations

Generative AI (GenAI) is a powerful tool, but it can sometimes produce outputs that appear true but are actually false. These false outputs are known as hallucinations. As GenAI becomes more widely used, concerns about these hallucinations are growing, and the demand for insurance coverage against such risks is expected to rise. The market for

Read More
summer 24 analytics release notes

Summer 24 Analytics Release Notes

Analytics summer 24 enhancements include new and updated features for Lightning reports and dashboards, Data Cloud reports and dashboards, CRM Analytics, Intelligent apps, and Tableau. Summer 24 Analytics Release Notes. Like Related Posts Salesforce OEM AppExchange Expanding its reach beyond CRM, Salesforce.com has launched a new service called AppExchange OEM Edition, aimed at non-CRM service

Read More
Retrieval Augmented Generation in Artificial Intelligence

RAG – Retrieval Augmented Generation in Artificial Intelligence

Salesforce has introduced advanced capabilities for unstructured data in Data Cloud and Einstein Copilot Search. By leveraging semantic search and prompts in Einstein Copilot, Large Language Models (LLMs) now generate more accurate, up-to-date, and transparent responses, ensuring the security of company data through the Einstein Trust Layer. Retrieval Augmented Generation in Artificial Intelligence has taken

Read More
Big Data and Data Visualization

Big Data and Data Visualization Explained

Data Visualization: Turning Complex Data into Clear Insights Data visualization is the practice of converting information into visual formats, such as maps or graphs, to make data more accessible and understandable. The primary purpose of data visualization is to highlight patterns, trends, and outliers within large data sets, allowing users to quickly glean insights. The

Read More
  • 1
  • 2
gettectonic.com