
Salesforce BI helps to create fast, digestible reports to help you make informed decisions at the right time. Salesforce Einstein is a leading business intelligence software solution that will help streamline your operations. Read on in this insight to learn how Salesforce BI capabilities including Tableau rank in the Gartner Magic Quadrant.
Make the right decision every time using analytics that go beyond business intelligence software.
See why Gartner named Salesforce (Tableau) a Leader in the Gartner® Magic Quadrant™ for Analytics and Business Intelligence Platforms for the 11th consecutive year.
Data and analytics leaders must use analytics and BI platforms to support the needs of IT, analysts, consumers and data scientists. While integration with cloud ecosystems and business applications is a key selection requirement, buyers also need platforms to support openness and interoperability.
Analytics and business intelligence (ABI) platforms enable less technical users, including business people, to model, analyze, explore, share and manage data, and collaborate and share findings, enabled by IT and augmented by artificial intelligence (AI).
For several years, the Magic Quadrant for Analytic and Business Intelligence Platforms has emphasized visual self-service for end users augmented by AI to deliver automated insights.
While this remains a significant use case, the ABI platform market will increasingly need to focus on the needs of the analytic content consumer and business decision makers. To achieve this, automated insights must be relevant in context of a user’s goals, actions and workflow.
Many platforms are adding capabilities for users to easily compose low-code or no-code automation workflows and applications. This blend of capabilities is helping to expand the vision for analytics beyond simply delivering datasets and presenting dashboards. Today’s ABI platforms can deliver enriched contextualized insights, refocus attention on decision-making processes and ultimately take actions that will deliver business value.
In addition to the increasing consumer design focus trend, we see other key market trends, including the need for improved governance of analytic content creation and dissemination, and the demand for a headless, open architecture. For example, a headless ABI platform would decouple the metrics store from the front-end presentation layer, enabling more interoperability with competitive products.
ABI platform functionality includes the following 12 critical capabilities, which have been updated to reflect areas of market change, differentiation and customer demand:
- Automated insights — A core attribute of augmented analytics, this is the ability to apply machine learning (ML) techniques to automatically generate insights for end users (for example, by identifying the most important attributes in a dataset).
- Analytics catalog — This refers to the product’s ability to display analytic content to make it easy to find and consume. The catalog is searchable and makes recommendations to users.
- Data preparation — Data preparation includes support for drag-and-drop, user-driven combination of data from different sources, and the creation of analytic models (such as user-defined measures, sets, groups and hierarchies).
- Data source connectivity — Data source connectivity capabilities enable users to connect to and ingest structured data contained in various types of storage platforms, both on-premises and in the cloud.
- Data storytelling — Data storytelling is the ability to combine interactive data visualization with narrative techniques to package and deliver insights in a compelling, easily understood form for presentation to decision makers.
- Data visualization — Data visualization involves support for highly interactive dashboards and exploration of data through the manipulation of chart images. Included is an array of visualization options that go beyond those of pie, bar and line charts, such as heat and tree maps, geographic maps, scatter plots and other special-purpose visuals.
- Governance — Governance capabilities track usage and manage how information is shared and promoted.
- Natural language query — The natural language query (NLQ) capability enables users to ask questions of the data using terms that are either typed into a search box or spoken.
- Reporting — The reporting capability provides pixel-perfect, paginated reports that can be scheduled and bursted to a large user community.
- Data science integration — Capabilities that enable augmented development and prototyping of composable data science and machine learning (DSML) models by citizen data scientists and data scientists with integration into the broader data science and machine learning ecosystem.
- Metrics store — The ability to provide a virtualized layer that allows users to create and define metrics as code, govern those metrics from data warehouses, and service all downstream analytics, data science and business applications. This also includes capabilities such as goal management.
- Collaboration — Analytics collaboration is the application of collaboration capabilities to analytics workstreams for organizations that want to provide an environment where a broad spectrum of users can simultaneously co-produce an analytics project.
Gartner added three new critical capabilities as part of our metrics store evaluation criteria this year:
ABI platforms have always been about measurement. For decades, the slicing and dicing of measures by their dimensional attributes was synonymous with the act of performing business intelligence. However, over the last decade, the focus on metrics and measurement was overshadowed by data visualization. As data visualization became the most conspicuous capability, some business executives began to conflate ABI platforms with data visualization — as if ABI platforms are glorified chart wizards. This misconception minimizes much of the work performed and the business value delivered by ABI platforms. Establishing metrics stores as a critical capability to execute makes it clear that defining and communicating performance measures throughout an organization is one of the key purposes of an ABI platform.
Analytics collaboration is a combination of many features (such as Slack/Teams integration, action frameworks) that collectively improve an organization’s ability to make decisions with consensus. Data science integration reflects the increasing likelihood that a business analyst may want to use data science to test certain hypotheses, and that data scientists will need to leverage features such as data prep and data visualization.
In addition, Gartner is changing “catalogs” to “analytic catalogs” to emphasize a set of requirements that are not being met by ABI platform vendors today. Most large enterprises have thousands of reports built across multiple ABI platforms, but consumers in these organizations have no easy way to access these reports. The name change to analytic catalogs reflects the need for ABI platform vendors to deliver analytic content with the consumer in mind.
Three critical capabilities were removed from our evaluation criteria:
security, natural language generation (NLG; rolled into data storytelling) and cloud analytics (which will no longer be considered a platform capability, but instead a go-to-market strategy covered in the Magic Quadrant). And one of the security sub-criteria, about the granularity of authorization (e.g., row-based security) has been moved to the enterprise reporting capability.
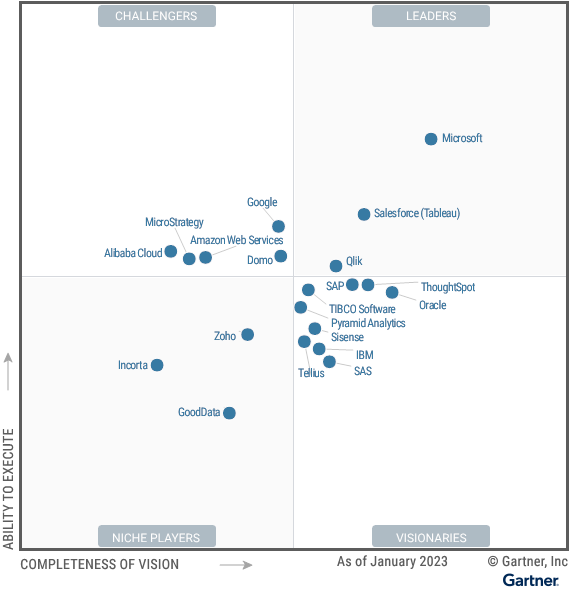
Salesforce (Tableau)
Tableau, a Salesforce company, is a Leader in this Magic Quadrant.
Its products are mainly focused on visual-based exploration that enables business users to access, prepare, analyze and present findings in their data. CRM Analytics, formerly Tableau CRM, provides augmented analytics capabilities for analysts and citizen data scientists. Tableau has global operations and serves clients of all sizes.
In 2022, Tableau reinforced its augmented consumer vision to provide contextualized insights with deeper integration with Salesforce Data Cloud. IT also improved decision intelligence by bringing domain-aware insights into action with Revenue Intelligence and other Salesforce-native apps. The extensible design and x-platform integrations (Salesforce Flow, MuleSoft, UiPath and Looker) further enable composable analytics to bring insights into workflow with agility.
Strengths
- Tableau as a skill: Tableau has created a massive community of visual analytic developers that influences ABI buying decisions. Its user community has become a strong self-learning hub to drive tool adoption, improving its market momentum by increasingly demanding Tableau skills from the talent market.
- Agnostic and flexible position: Although acquired by Salesforce, Tableau remains a more cloud-, data source- and application-agnostic choice compared to some of its competitors. The users can still use the on-premises version with little difference from the cloud version. Organizations today still use a portfolio approach to build the analytics solutions, and Tableau has better composability in a wider D&A ecosystem with technology partnership.
- Analytics experience: The proprietary VizQL engine sits at the center of the entire analytics workflow of Tableau, providing an optimal visual analytics experience while more augmented analytics capabilities are incorporated into the platform. The user-centric product improves the multi-persona collaboration within the tool, expanding the adoption of the tool by more business users.
Cautions
- Market momentum and support concerns: While it is still showing strong market momentum, Tableau has had slower revenue growth recently. And clients are sharing concerns about recent layoffs. Also, timeliness of some support functions continues to be an issue, particularly for Standard Support customers, some of whom feel compelled to purchase the Premium Support add-on to receive adequate support.
- Salesforce-centric innovation: Some of Tableau’s emerging capabilities, including CRM Analytics and Data Cloud, are designed to integrate with Salesforce. Some clients have expressed concerns about not getting the most of the combined platform if they don’t move to Salesforce. Alternatively, they will need to spend extra to get the capabilities that belong to the other product lines.
- Serve on-premises clients: Tableau has a huge number of on-premises clients who use Tableau desktop and server. With the acquisition from Salesforce, the product portfolio has a clear direction to be cloud-first or even cloud-only, aligning with the overall Salesforce product strategy. This move could impact existing clients who have no plan to move to the cloud soon.
Who is Salesforce? Here is their story in their own words. From our inception, we've proudly embraced the identity of Read more
Salesforce Marketing Cloud Transactional Emails are immediate, automated, non-promotional messages crucial to business operations and customer satisfaction, such as order Read more

Salesforce has unveiled a comprehensive analytics solution tailored for wealth managers, home office professionals, and retail bankers, merging its Financial Read more
AI plays a crucial role in propensity score estimation as it can discern underlying patterns between treatments and confounding variables Read more