Leeds and Other Heatmap Solutions
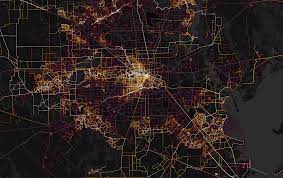
With over 80% of people shopping online – and the numbers are bound to rise – it’s important to know how your would-be customers behave on your website: where they click, how they scroll, and what motivates them to take specific actions. Heatmap analytics does it, allowing you to dominate CRO and UX through effective behavior data interpretation. This insight will look at Leeds and Other Heatmap Solutions. Powered by heatmap software and heatmap tools, heatmap analytics can help you convert customers at scale by optimizing their on-site and mobile experience. Make no mistake: the quality of user behavior tracking can make a difference between a closed sale and a bounce. Leads Heatmap Software is an innovative tool that transforms complex lead data into easy-to-understand, color-coded heatmaps within Salesforce CRM. This solution uses advanced data visualization techniques, enabling users to quickly identify high-potential leads. Interactive Heatmaps Leverage dynamic, real-time heatmaps to visualize lead density and quality, making it easier to pinpoint high-potential areas. Real-Time Updates Stay up-to-date with the latest information as heatmaps automatically refresh with new leads or changes to existing data, ensuring you always have the most current view. Enhanced Analytics Dive deeper into lead behavior and trends with comprehensive analytics tools that provide detailed reports and predictive insights. Detailed Lead Profiles Access in-depth lead profiles directly from the heatmap, including contact details, engagement history, and quick shortcuts for a complete view of each lead. Online Chat Integration Interact with leads instantly using integrated online chat, facilitating immediate and personalized communication. All website pages have a purpose, whether that purpose is to drive further clicks, qualify visitors, provide a solution, or even a mix of all of those things. Heatmaps and recorded user sessions allow you to see if your page is serving that purpose or going against it. What Is a Heatmap? Generally speaking, heatmaps are graphical representations of data that highlight value with color. On a website heatmap, the most popular areas are showcased in red (hot) and the least popular are in blue (cold). The colors range on a scale from red to blue. Heatmaps are an excellent method of collecting user behavior data and converting it into a deep analysis of how visitors engage with your website pages. It can analyze: That information will help you identify user trends and key into what should be optimized to up engagement. Setting up website heatmapping software is a great start to refining your website design process and understanding your users. When to Use Heatmaps The truth is that heatmaps can actually be invaluable when testing and optimizing user experiences and conversion opportunities. There are many times you should be using them. Redesigning Your Website Updating, or even upgrading, your website isn’t just a task on your to do list. Careful thought, attention, and creativity should be put into the revamp if you want it to be worth the time and resources. Heatmaps can help with studying your current design to identify what your visitors are engaging with and what they’re ignoring. You’ll be tapped into what makes your visitors tick so that you can build a site meant specifically for your unique audience. Analyzing Webpage Conversions Trying to figure out why certain pages aren’t converting the way you thought they would? Use a heatmap. You’ll be able to identify exactly what’s attracting attention and deduce why. The same goes for buttons and pages that are showing a higher rate of conversion than anticipated. By keying into the design, copy, and other elements that are working for you, you’ll know exactly how to optimize your under-performing webpages. Testing New Updates As your business grows and you develop new ideas, naturally you’ll want to test them. A/B testing allows you to measure and analyze visitor response to a project or design, but you can take it a step further with heatmapping. Leverage the data graph by examining exactly what captures your visitors’ attention. At the end of the testing period, you may be able to pull designs or elements that received high levels of engagement from the page that didn’t perform as well into the successful one. How To Analyze Visually Using the color-coded visualizations, you can read your webpage for engagement levels and attention “hot spots.” Where the map reads red, that’s where visitors are showing the highest points of interactivity. Blue reflects low numbers. You can spot design issues or opportunities to move buttons, forms, and the like with a visual read. Data Points Reviewing raw data tables will give you more specific insights into your page’s performance. You can examine HTML elements and pixel locations of clicks to really understand what’s drawing people in. You can even filter your clicks and views in order of popularity with certain software. This takes the guessing out of your redesign and testing efforts. Tableau has instant, real-time reporting in place for users looking for actionable insights. With smart dashboards and a drag and drop interface, navigating the product is easy. Their cloud storage means omni-channel data access from anywhere. You can perform ad hoc analyses whenever it’s convenient for you. You can also share your reports with anyone to boost business impact. With built in A/B testing and consolidated heatmaps, Freshmarketer puts in the extra effort to plot out visitor interactions. Recorded in real time, you can analyze heatmaps based by device, which the software automatically detects. Offering scrollmaps and click maps, Freshmarketer strives to “go beyond traditional heatmaps.” Looker offers similar services to the other software options listed, but they also supply a unique security management feature to protect your data. Also partnered with Google Cloud, you’ll have access to reporting from anywhere in the world. Primarily a data analysis solution, you’ll have access to other data intelligence and visualization features as well. Hotjar is one of the most popular website analytics software suites, offering free heatmaps for desktop, mobile, and tablet within its basic subscription plan. You can create heatmaps and synergize them with other free features like user session recordings, surveys, and


