Data Visualization Archives - gettectonic.com - Page 3
Key Benefits of Dynamic Dashboards

Key Benefits of Dynamic Dashboards

What Is a Salesforce Dynamic Dashboard? A Dynamic Dashboard customizes data visibility based on a user’s role or access level. Unlike standard dashboards, which present static data predefined by the creator, dynamic dashboards automatically adjust their content according to the logged-in user. For example, in a sales team, individual representatives see their performance against quotas, while a manager gets a comprehensive view of the entire team’s progress—all within a single dashboard. Why Use a Dynamic Dashboard? Dynamic dashboards offer unparalleled flexibility, personalization, and efficiency, making them an indispensable Salesforce feature. Their advantages include: Key Features of Dynamic Dashboards: Standard vs. Dynamic Dashboards Feature Standard Dashboard Dynamic Dashboard Data View Fixed for all users Adjusts based on user role Customization Limited Flexible, role-based Security General access Role-based access control Maintenance Requires multiple versions Single adaptable dashboard Example Use Cases: Key Benefits of Salesforce Dynamic Dashboards Personalized Data Visualization Tailor dashboards to display role-specific metrics, ensuring users focus on the most relevant insights. Enhanced Role-Based Access Restricts data access to authorized personnel, improving security and compliance. Increased Efficiency Reduces dashboard duplication, saving administrative time and effort. Real-Time Insights Automatically refreshes data, keeping teams informed with the latest metrics. Simplified Collaboration Facilitates team alignment by ensuring stakeholders have access to relevant data. Salesforce Dynamic Dashboard Limits & Restrictions How to Create a Dynamic Dashboard in Salesforce Step 1: Navigate to Dashboards Step 2: Define Dashboard Properties Step 3: Add Components Step 4: Set the Running User Step 5: Save and Test Step 6: Optimize Layout Mastering Dynamic Dashboards: 5 Steps for Optimization Advanced Features & Tips Dynamic Dashboards in Lightning Experience Cross-Filtering Across Components Key Takeaways By implementing dynamic dashboards effectively, businesses can streamline reporting, empower teams with actionable data, and drive strategic growth. Like Related Posts Who is Salesforce? Who is Salesforce? Here is their story in their own words. From our inception, we’ve proudly embraced the identity of Read more Salesforce Marketing Cloud Transactional Emails Salesforce Marketing Cloud Transactional Emails are immediate, automated, non-promotional messages crucial to business operations and customer satisfaction, such as order Read more Salesforce Unites Einstein Analytics with Financial CRM Salesforce has unveiled a comprehensive analytics solution tailored for wealth managers, home office professionals, and retail bankers, merging its Financial Read more AI-Driven Propensity Scores AI plays a crucial role in propensity score estimation as it can discern underlying patterns between treatments and confounding variables Read more


Read More
CRM Analytics and Tableau

CRM Analytics and Tableau

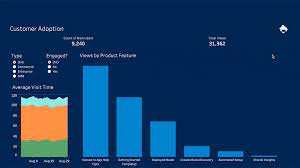
Whether you’re exploring data visualization tools or delving into the realm of analytics, Tableau and Salesforce CRM Analytics (formerly known as Tableau CRM) likely appear on your radar, both under the Salesforce umbrella. In this discussion, we’ll scrutinize the key disparities between these solutions and discern when one triumphs over the other. Firstly, let’s clarify the essence of both platforms: Tableau stands as a standalone, user-centric business intelligence platform, offering a suite of products like Tableau Prep, Tableau Desktop, and Tableau Online, tailored for data preparation, visualization, and dissemination. Salesforce CRM Analytics embeds analytics and reporting within Salesforce, furnishing insights seamlessly within your CRM workflow, predominantly drawing data from your Salesforce environment while accommodating certain external data sources. Here’s a comparative glimpse: Tableau: Salesforce CRM Analytics: Moreover, Salesforce offers Einstein Discovery, an AI-powered analytics tool augmenting data analysis with machine-learning models and statistical analysis. It enables swift detection of correlations, prediction of outcomes, and recommendation of improvement strategies, enhancing proactive decision-making. This plug-in seamlessly integrates with both Salesforce CRM Analytics and Tableau, subject to appropriate licensing. In contemplating between Tableau and CRM Analytics, Charlotte Bayart, Data & AI consultant at delaware, emphasizes the level of reporting: “For business reports on a management level, Tableau will likely excel due to its versatility and powerful visualizations. However, for operational reporting within CRM workflows necessitating real-time insights and immediate actionability, CRM Analytics proves indispensable. With embedded solutions like CRM Analytics, users gain direct access to detailed insights without additional layers, facilitating prompt decision-making and action.” Ultimately, organizations leveraging Salesforce as a CRM platform might find synergy in employing both Tableau and CRM Analytics concurrently, optimizing their analytical prowess across various reporting needs. Like1 Related Posts Who is Salesforce? Who is Salesforce? Here is their story in their own words. From our inception, we’ve proudly embraced the identity of Read more Salesforce Marketing Cloud Transactional Emails Salesforce Marketing Cloud Transactional Emails are immediate, automated, non-promotional messages crucial to business operations and customer satisfaction, such as order Read more Salesforce Unites Einstein Analytics with Financial CRM Salesforce has unveiled a comprehensive analytics solution tailored for wealth managers, home office professionals, and retail bankers, merging its Financial Read more AI-Driven Propensity Scores AI plays a crucial role in propensity score estimation as it can discern underlying patterns between treatments and confounding variables Read more
Read More
Tableau vs Datorama

What is the Difference Between Datorama and Tableau?

In the current business environment, customer and prospect data serve as the driving force in most everything we do, emphasizing the importance of analyzing, understanding, and acting on accurate data for informed decision-making. Business Intelligence (BI) tools like Datorama and Tableau play an important role in facilitating these processes. This insight conducts a comparative analysis of Datorama vs. Tableau, covering features, capabilities, pricing, support, and training options. Tectonic’s goal is to assist businesses in making informed decisions aligned with their specific needs. If you are choosing between these two tools, contact Tectonic for assistance. Overview of Datorama: Datorama, a cloud-based BI platform, specializes in providing insights into data across a variety of marketing channels. Offering real-time analytics and pre-built connectors for various marketing platforms, Datorama serves as a comprehensive tool for marketing analytics. Its dashboard provides a centralized view of marketing data, automates real-time processing, and incorporates AI-powered insights generated by Salesforce Einstein. Overview of Tableau: Tableau, a widely used BI platform, facilitates easy data connection and visualization. With a user-friendly interface, it allows users to build interactive dashboards and visualizations without coding expertise. Tableau’s adaptability enables it to connect to various data sources, create interactive visualizations, offer data blending, and include forecasting capabilities. Key Features of Datorama and Tableau: Datorama Features: Tableau Features: Pricing Models: Datorama: Custom plans with varying costs based on specific business needs, starting at $3,000 USD per month. Tableau: Tiered plans with pricing ranging from $12 to $70 per user per month. Support and Training: Datorama: Knowledge base, community forums, training courses, and a certification program. Tableau: 24/7 support, online courses, and live training sessions. Choosing the Right BI Solution: Datorama: Suited for businesses with complex data integration needs, ideal for multi-channel marketing analytics and forecasting, offers advanced AI-powered insights. Tableau: Suited for businesses with data visualization and reporting needs, ideal for ad-hoc data analysis and dashboarding, offers powerful visualization capabilities. Benefits of Integration: Final Thoughts: Both Datorama and Tableau excel as BI tools, offering unique strengths. Datorama is tailored for marketing analytics with real-time insights, while Tableau provides versatility in connecting and visualizing data from various sources. Choosing the right solution depends on specific business needs, goals, and budget considerations. Contact Tectonic today for assistance. Like2 Related Posts Who is Salesforce? Who is Salesforce? Here is their story in their own words. From our inception, we’ve proudly embraced the identity of Read more Salesforce Marketing Cloud Transactional Emails Salesforce Marketing Cloud Transactional Emails are immediate, automated, non-promotional messages crucial to business operations and customer satisfaction, such as order Read more Salesforce Unites Einstein Analytics with Financial CRM Salesforce has unveiled a comprehensive analytics solution tailored for wealth managers, home office professionals, and retail bankers, merging its Financial Read more AI-Driven Propensity Scores AI plays a crucial role in propensity score estimation as it can discern underlying patterns between treatments and confounding variables Read more
Read More
Salesforce Advanced Reporting

Salesforce Advanced Reporting

Data Is EverywhereIt’s no exaggeration to say that data is omnipresent. With 2.5 quintillion bytes of digital data generated every day, it’s clear that the modern world runs on information. For businesses, this data surge presents immense opportunities. By capturing, organizing, analyzing, and interpreting it effectively, organizations have enhanced their processes and targeted their marketing efforts with precision. Tools That Communicate InsightsHowever, finding data is only the first step. Even actionable insights must be presented clearly to decision-makers, or they risk being overlooked. A staggering 48% of employees report struggling with data that is not optimized for their needs. This issue spans industries, highlighting the critical role that reporting tools play in business success. Effective tools rely on data visualization to make complex information easy to comprehend. Visual displays allow for faster digestion of data, turning raw information into actionable insights. Modern dashboards and visualization software combine reporting and clarity, ensuring accessibility for all users, regardless of technical expertise. Ease of Use Is CriticalThe best data reporting tools aren’t just powerful—they’re user-friendly. Tools that are overly complex risk becoming ongoing IT projects, diminishing their value to leaders and decision-makers. An intuitive interface, coupled with automation and compatibility across all devices, minimizes reliance on IT support. Real-time reporting is one of the most valuable features advanced tools offer. In today’s fast-paced world, outdated information—even by a few days—can lead to costly mistakes. Real-time data ensures decisions are based on the most current insights, while intuitive tools empower users to access these insights independently. One Tool, Unlimited CompatibilityThe rise of mobile work environments means employees increasingly rely on their personal devices for business tasks. High-performing teams are 3.5 times more likely to use mobile reporting tools to analyze data on the go. Cloud-based, platform-agnostic reporting tools ensure no user is ever limited by their location or device. Additionally, customizable and scalable tools provide businesses the flexibility to adapt as they grow, delivering a seamless reporting experience tailored to their unique needs. By researching available tools, leveraging online reviews, and utilizing free trials, businesses can find reporting solutions that align with their goals. Turning Data Into ActionData is only as valuable as its application. The right reporting tools provide organizations with reliable insights, empowering informed decision-making. As businesses increasingly recognize the power of data, investing in the right tools can drive efficiency, productivity, and smarter strategies. Advanced Reporting in Salesforce Salesforce reporting is one of its most powerful features, enabling users to gain insights into their data while allowing admins to demonstrate Salesforce’s impact on productivity. With the Lightning Report Builder, a drag-and-drop interface, admins can quickly create reports that meet complex requirements. Here’s a closer look at Salesforce’s advanced reporting capabilities: 1. Custom Report Types Salesforce provides out-of-the-box report types for standard objects and relationships (e.g., Contacts & Accounts). Custom Report Types go beyond these by allowing reports on: Admins can define up to four objects and specify relationships to tailor reports to their needs. A bonus? New fields can now be auto-added to Custom Report Types. 2. Cross Filters (Exception Reports) Cross Filters identify records with or without related records, perfect for “exception reports.” For example: Admins can add sub-filters for even more precision. 3. Summary Formulas Summary Formulas handle complex calculations across grouping levels, providing deeper insights. Example: Calculate each account’s contribution to pipeline by opportunity type. 4. Row-Level Formulas These formulas apply to individual records and are displayed on the row itself. For example, compare two fields on the same record to check for matching values. 5. Reporting Snapshots Snapshots “freeze” Salesforce data at specific moments for future reference, such as tracking Opportunity Pipeline changes over time. 6. Historical Trend Reporting Trend reports track historical field values for specific dates, such as Opportunities’ pipeline values for a given week. 7. Field-to-Field Filters These filters compare values across fields in a report. For instance, display only Contacts whose donations this year exceed last year’s. 8. Stacked Summaries Stacked Summaries condense large datasets into digestible visualizations, ideal for quick comparisons. 9. Joined Reports Combine multiple report types into a single view for holistic insights. Each “block” has its own filters, offering flexibility in data presentation. 10. Report URL Hacks URL hacks allow dynamic filtering of reports based on record data. For example, launch a filtered Opportunities report directly from an Account record. SummarySalesforce’s advanced reporting features empower admins to create scalable, efficient reports, even with challenging data models. By leveraging these tools, businesses can maximize the value of their Salesforce investment and transform raw data into actionable insights. Like Related Posts Who is Salesforce? Who is Salesforce? Here is their story in their own words. From our inception, we’ve proudly embraced the identity of Read more Salesforce Marketing Cloud Transactional Emails Salesforce Marketing Cloud Transactional Emails are immediate, automated, non-promotional messages crucial to business operations and customer satisfaction, such as order Read more Salesforce Unites Einstein Analytics with Financial CRM Salesforce has unveiled a comprehensive analytics solution tailored for wealth managers, home office professionals, and retail bankers, merging its Financial Read more AI-Driven Propensity Scores AI plays a crucial role in propensity score estimation as it can discern underlying patterns between treatments and confounding variables Read more

Read More
Tableau vs Datorama

Datorama vs Tableau – What About Both?

Datorama vs Tableau – What about both for your Salesforce org? When comparing Datorama vs Tableau it becomes clear they each have compelling reasons for their use. Datorama Tableau What’s the difference between Datorama and Tableau? Tableau is primarily a data visualization and reporting tool, while Datorama is a marketing analytics platform. “So it’s not surprising that their functions are somewhat different, ”explains the business development manager. Selecting a BI tool that meets all your business goals can be a very complicated task. There are many aspects to take into account, and there will be some cases that would make you lean towards one solution or another. Datorama (currently Marketing Cloud Intelligence) and Tableau, both solutions from Salesforce, are available on the market for companies that want to incorporate BI into their management. In the following, we will describe some of their main characteristics and a comparison of two, taking into account factors that can help you decide on their use according to the needs or possibilities of your company. Did you know that Datorama and Tableau can work together? Benefits of Datorama and Tableau Integration Datorama’s integration with Tableau powers results in the unified analysis of both business and marketing data, enabling the following: Like2 Related Posts Who is Salesforce? Who is Salesforce? Here is their story in their own words. From our inception, we’ve proudly embraced the identity of Read more Salesforce Marketing Cloud Transactional Emails Salesforce Marketing Cloud Transactional Emails are immediate, automated, non-promotional messages crucial to business operations and customer satisfaction, such as order Read more Salesforce Unites Einstein Analytics with Financial CRM Salesforce has unveiled a comprehensive analytics solution tailored for wealth managers, home office professionals, and retail bankers, merging its Financial Read more AI-Driven Propensity Scores AI plays a crucial role in propensity score estimation as it can discern underlying patterns between treatments and confounding variables Read more

Read More
public sector and tribal governent

What is BI in Salesforce?

Salesforce BI helps to create fast, digestible reports to help you make informed decisions at the right time. Salesforce Einstein is a leading business intelligence software solution that will help streamline your operations. Read on in this insight to learn how Salesforce BI capabilities including Tableau rank in the Gartner Magic Quadrant. Make the right decision every time using analytics that go beyond business intelligence software. See why Gartner named Salesforce (Tableau) a Leader in the Gartner® Magic Quadrant™ for Analytics and Business Intelligence Platforms for the 11th consecutive year. Data and analytics leaders must use analytics and BI platforms to support the needs of IT, analysts, consumers and data scientists. While integration with cloud ecosystems and business applications is a key selection requirement, buyers also need platforms to support openness and interoperability. Analytics and business intelligence (ABI) platforms enable less technical users, including business people, to model, analyze, explore, share and manage data, and collaborate and share findings, enabled by IT and augmented by artificial intelligence (AI). For several years, the Magic Quadrant for Analytic and Business Intelligence Platforms has emphasized visual self-service for end users augmented by AI to deliver automated insights. While this remains a significant use case, the ABI platform market will increasingly need to focus on the needs of the analytic content consumer and business decision makers. To achieve this, automated insights must be relevant in context of a user’s goals, actions and workflow. Many platforms are adding capabilities for users to easily compose low-code or no-code automation workflows and applications. This blend of capabilities is helping to expand the vision for analytics beyond simply delivering datasets and presenting dashboards. Today’s ABI platforms can deliver enriched contextualized insights, refocus attention on decision-making processes and ultimately take actions that will deliver business value. In addition to the increasing consumer design focus trend, we see other key market trends, including the need for improved governance of analytic content creation and dissemination, and the demand for a headless, open architecture. For example, a headless ABI platform would decouple the metrics store from the front-end presentation layer, enabling more interoperability with competitive products. ABI platform functionality includes the following 12 critical capabilities, which have been updated to reflect areas of market change, differentiation and customer demand: Gartner added three new critical capabilities as part of our metrics store evaluation criteria this year:  ABI platforms have always been about measurement. For decades, the slicing and dicing of measures by their dimensional attributes was synonymous with the act of performing business intelligence. However, over the last decade, the focus on metrics and measurement was overshadowed by data visualization. As data visualization became the most conspicuous capability, some business executives began to conflate ABI platforms with data visualization — as if ABI platforms are glorified chart wizards. This misconception minimizes much of the work performed and the business value delivered by ABI platforms. Establishing metrics stores as a critical capability to execute makes it clear that defining and communicating performance measures throughout an organization is one of the key purposes of an ABI platform. Analytics collaboration is a combination of many features (such as Slack/Teams integration, action frameworks) that collectively improve an organization’s ability to make decisions with consensus. Data science integration reflects the increasing likelihood that a business analyst may want to use data science to test certain hypotheses, and that data scientists will need to leverage features such as data prep and data visualization. In addition, Gartner is changing “catalogs” to “analytic catalogs” to emphasize a set of requirements that are not being met by ABI platform vendors today. Most large enterprises have thousands of reports built across multiple ABI platforms, but consumers in these organizations have no easy way to access these reports. The name change to analytic catalogs reflects the need for ABI platform vendors to deliver analytic content with the consumer in mind. Three critical capabilities were removed from our evaluation criteria: security, natural language generation (NLG; rolled into data storytelling) and cloud analytics (which will no longer be considered a platform capability, but instead a go-to-market strategy covered in the Magic Quadrant). And one of the security sub-criteria, about the granularity of authorization (e.g., row-based security) has been moved to the enterprise reporting capability. Salesforce (Tableau) Tableau, a Salesforce company, is a Leader in this Magic Quadrant. Its products are mainly focused on visual-based exploration that enables business users to access, prepare, analyze and present findings in their data. CRM Analytics, formerly Tableau CRM, provides augmented analytics capabilities for analysts and citizen data scientists. Tableau has global operations and serves clients of all sizes. In 2022, Tableau reinforced its augmented consumer vision to provide contextualized insights with deeper integration with Salesforce Data Cloud. IT also improved decision intelligence by bringing domain-aware insights into action with Revenue Intelligence and other Salesforce-native apps. The extensible design and x-platform integrations (Salesforce Flow, MuleSoft, UiPath and Looker) further enable composable analytics to bring insights into workflow with agility. Strengths Cautions Like Related Posts Who is Salesforce? Who is Salesforce? Here is their story in their own words. From our inception, we’ve proudly embraced the identity of Read more Salesforce Marketing Cloud Transactional Emails Salesforce Marketing Cloud Transactional Emails are immediate, automated, non-promotional messages crucial to business operations and customer satisfaction, such as order Read more Salesforce Unites Einstein Analytics with Financial CRM Salesforce has unveiled a comprehensive analytics solution tailored for wealth managers, home office professionals, and retail bankers, merging its Financial Read more AI-Driven Propensity Scores AI plays a crucial role in propensity score estimation as it can discern underlying patterns between treatments and confounding variables Read more

Read More
gettectonic.com