Salesforce Sales Analytics Archives - gettectonic.com
advanced analytics

Maximizing Sales Performance with Salesforce Sales Analytics

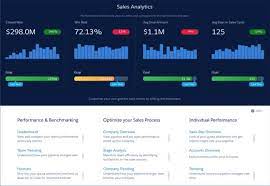
Salesforce, a leading CRM platform, provides powerful sales analytics tools that empower businesses to make data-driven decisions, boost productivity, and drive revenue growth. This guide highlights the importance of Salesforce Sales Analytics, its key features, and how to leverage them to optimize your sales team’s performance. Key Features of Salesforce Sales Analytics 1. Reports and Dashboards Salesforce’s reporting capabilities enable users to create custom dashboards and reports for real-time insights into lead conversion, sales performance, and other critical metrics. These visual tools help businesses track trends and make informed decisions effortlessly. 2. Einstein Analytics Powered by AI and machine learning, Einstein Analytics offers: 3. Sales Cloud Analytics Sales Cloud Analytics helps businesses: 4. Forecasting Tools Salesforce’s AI-powered forecasting tools provide accurate revenue projections by analyzing: How Different Teams Benefit from Sales Analytics ✅ Executives – Gain a high-level view of sales, service, and pipeline performance with real-time dashboards highlighting key business metrics. ✅ Sales Managers – Monitor team performance, track quota attainment, analyze pipeline changes, and optimize sales cycles to accelerate deal closures. ✅ Sales Representatives – Get insights into personal sales performance, pipeline activities, and quota attainment, allowing for quicker decision-making and identification of new business opportunities. ✅ Operations Teams – Analyze sales performance by customer, region, and source to optimize negotiation strategies and business development efforts. Setting Up the Salesforce Sales Analytics App 1. Launch Analytics Studio Navigate to Analytics Studio via the Sales Home page and click on the Apps button. 2. Search for Sales Analytics If the Sales Analytics App does not appear by default, use the search bar to locate it. 3. Access the Default Dashboard The default dashboard provides key metrics, including: 4. Customize Widgets Modify data representation by selecting the Edit button and customizing widgets to align with your business needs. 5. Adjust Goal Widgets Update goal widgets to match your sales targets and business objectives. 6. Explore Additional Dashboards Salesforce offers role-specific dashboards for Sales Managers, Executives, and other stakeholders to gain tailored insights. 7. Utilize the Lens Feature for Visualizations Leverage Lens to create object-specific visualizations, such as opportunities by time, stage, owner, and more. Conclusion Integrating Salesforce Sales Analytics with Tableau CRM creates a comprehensive Business Intelligence (BI) solution. However, businesses looking for a simpler or more cost-effective alternative may consider exporting Salesforce data into third-party analytics platforms for additional flexibility and ease of use. By leveraging Salesforce Sales Analytics, businesses can enhance forecasting, improve decision-making, and drive sales performance with real-time insights. Like1 Related Posts Salesforce OEM AppExchange Expanding its reach beyond CRM, Salesforce.com has launched a new service called AppExchange OEM Edition, aimed at non-CRM service providers. Read more The Salesforce Story In Marc Benioff’s own words How did salesforce.com grow from a start up in a rented apartment into the world’s Read more Salesforce Jigsaw Salesforce.com, a prominent figure in cloud computing, has finalized a deal to acquire Jigsaw, a wiki-style business contact database, for Read more Service Cloud with AI-Driven Intelligence Salesforce Enhances Service Cloud with AI-Driven Intelligence Engine Data science and analytics are rapidly becoming standard features in enterprise applications, Read more

Read More
Salesforce Sales Analytics

Salesforce Sales Analytics App

Sales Analytics empowers users to leverage the analytical capabilities of Analytics within Sales Cloud, accessible on any device supporting Analytics functionality. Featuring intuitive visualizations derived from Salesforce data, Sales Analytics facilitates a swift transition from insights to actionable strategies, enabling users to transform data into informed and intelligent sales decisions. The Salesforce Sales Analytics App provides improved visibility across departments. Built by Salesforce Built by Salesforce, Sales Analytics streamlines the analysis of Sales Cloud data. Whether you’re an executive, manager, sales representative, or involved in operations, Sales Analytics offers an elevated level of insight into your Salesforce data. Begin with the Sales Analytics Home dashboard to gain insights into recent wins, win rates, and average deal amounts. Dive deeper into other dashboards that utilize Sales Cloud Collaborative Forecasts to showcase quotas, aiding in precise forecasting. Executives benefit from a comprehensive overview highlighting pipeline and sales and service business performance, along with insights into top deals. Managers can access leaderboards displaying team key performance indicators (KPIs) and delve into specific details about quotas, pipeline changes, team trends, and average sales cycle time. Reps can monitor their own quota attainment, bookings, and pipeline activities, while operations staff can analyze performance by geography, source, and customer to identify trends and expedite new deals. App creation is simplified with Sales Analytics, conducting a compatibility check against your org to ensure the inclusion of all necessary data for app datasets and dashboards. If any data is missing, error messages guide you on the required additions before app creation. Once compatibility is confirmed, you have two options: Post-app creation, explore Sales Cloud data seamlessly across any device supporting CRM Analytics. The intuitive CRM Analytics interface delivers actionable insights promptly. Constantly allowing for in-depth exploration and customization of Sales Analytics tailored to your business requirements. Prebuilt dashboards in Sales Analytics feature key performance indicators (KPIs) for managing pipeline, visualizing quota data, fine-tuning forecasts, understanding business performance drivers, visualizing trends, and assigning actions. Use these dashboards to provide swift answers to business-related queries, ensuring value extraction from Salesforce data. Sales Analytics also incorporates lenses—focused visualizations providing greater detail about sales KPIs, enhancing dashboards. Upon creating Sales Analytics, the app automatically generates datasets based on existing Salesforce data. By encompassing standard and custom fields. These datasets fuel the dashboards and lenses. Instantly delivering insights necessary for effective business management. Users can further create custom lenses and dashboards utilizing the data within the Sales Analytics dataset. CRM Analytics, the rebranded Tableau CRM from Salesforce, represents a dynamic evolution from its previous incarnation, Einstein Analytics. Like1 Related Posts 50 Advantages of Salesforce Sales Cloud According to the Salesforce 2017 State of Service report, 85% of executives with service oversight identify customer service as a Read more How Travel Companies Are Using Big Data and Analytics In today’s hyper-competitive business world, travel and hospitality consumers have more choices than ever before. With hundreds of hotel chains Read more Marketing Cloud Account Engagement and Salesforce Campaigns The interplay between Account Engagement and Salesforce Campaigns often sparks confusion and frustration among users. In this insight, we’ll demystify Read more Integration of Salesforce Sales Cloud to Google Analytics 360 Announced In November 2017, Google unveiled a groundbreaking partnership with Salesforce, outlining their commitment to develop innovative integrations between Google Analytics Read more

Read More
gettectonic.com