Data Forecasting - gettectonic.com
Forecasting With Foundation Models

Forecasting With Foundation Models

On Hugging Face, there are 20 models tagged as “time series” at the time of writing. While this number is relatively low compared to the 125,950 results for the “text-generation-inference” tag, time series forecasting with foundation models has attracted significant interest from major companies such as Amazon, IBM, and Salesforce, which have developed their own models: Chronos, TinyTimeMixer, and Moirai, respectively. Currently, one of the most popular time series models on Hugging Face is Lag-Llama, a univariate probabilistic model developed by Kashif Rasul, Arjun Ashok, and their co-authors. Open-sourced in February 2024, the authors claim that Lag-Llama possesses strong zero-shot generalization capabilities across various datasets and domains. Once fine-tuned, they assert it becomes the best general-purpose model of its kind. In this insight, we showcase experience fine-tuning Lag-Llama and tests its capabilities against a more classical machine learning approach, specifically an XGBoost model designed for univariate time series data. Gradient boosting algorithms like XGBoost are widely regarded as the pinnacle of classical machine learning (as opposed to deep learning) and perform exceptionally well with tabular data. Therefore, it is fitting to benchmark Lag-Llama against XGBoost to determine if the foundation model lives up to its promises. The results, however, are not straightforward. The data used for this exercise is a four-year-long series of hourly wave heights off the coast of Ribadesella, a town in the Spanish region of Asturias. The data, available from the Spanish ports authority data portal, spans from June 18, 2020, to June 18, 2024. For the purposes of this study, the series is aggregated to a daily level by taking the maximum wave height recorded each day. This aggregation helps illustrate the concepts more clearly, as results become volatile with higher granularity. The target variable is the maximum height of the waves recorded each day, measured in meters. Several reasons influenced the choice of this series. First, the Lag-Llama model was trained on some weather-related data, making this type of data slightly challenging yet manageable for the model. Second, while meteorological forecasts are typically produced using numerical weather models, statistical models can complement these forecasts, especially for long-range predictions. In the era of climate change, statistical models can provide a baseline expectation and highlight deviations from typical patterns. The dataset is standard and requires minimal preprocessing, such as imputing a few missing values. After splitting the data into training, validation, and test sets, with the latter two covering five months each, the next step involves benchmarking Lag-Llama against XGBoost on two univariate forecasting tasks: point forecasting and probabilistic forecasting. Point forecasting gives a specific prediction, while probabilistic forecasting provides a confidence interval. While Lag-Llama was primarily trained for probabilistic forecasting, point forecasts are useful for illustrative purposes. Forecasts involve several considerations, such as the forecast horizon, the last observations fed into the model, and how often the model is updated. This study uses a recursive multi-step forecast without updating the model, with a step size of seven days. This means the model produces batches of seven forecasts at a time, using the latest predictions to generate the next set without retraining. Point forecasting performance is measured using Mean Absolute Error (MAE), while probabilistic forecasting is evaluated based on empirical coverage or coverage probability of 80%. The XGBoost model is defined using Skforecast, a library that facilitates the development and testing of forecasters. The ForecasterAutoreg object is created with an XGBoost regressor, and the optimal number of lags is determined through Bayesian optimization. The resulting model uses 21 lags of the target variable and various hyperparameters optimized through the search. The performance of the XGBoost forecaster is assessed through backtesting, which evaluates the model on a test set. The model’s MAE is 0.64, indicating that predictions are, on average, 64 cm off from the actual measurements. This performance is better than a simple rule-based forecast, which has an MAE of 0.84. For probabilistic forecasting, Skforecast calculates prediction intervals using bootstrapped residuals. The intervals cover 84.67% of the test set values, slightly above the target of 80%, with an interval area of 348.28. Next, the zero-shot performance of Lag-Llama is examined. Using context lengths of 32, 64, and 128 tokens, the model’s MAE ranges from 0.75 to 0.77, higher than the XGBoost forecaster’s MAE. Probabilistic forecasting with Lag-Llama shows varying coverage and interval areas, with the 128-token model achieving an 84.67% coverage and an area of 399.25, similar to XGBoost’s performance. Fine-tuning Lag-Llama involves adjusting context length and learning rate. Despite various configurations, the fine-tuned model does not significantly outperform the zero-shot model in terms of MAE or coverage. In conclusion, Lag-Llama’s performance, without training, is comparable to an optimized traditional forecaster like XGBoost. Fine-tuning does not yield substantial improvements, suggesting that more training data might be necessary. When choosing between Lag-Llama and XGBoost, factors such as ease of use, deployment, maintenance, and inference costs should be considered, with XGBoost likely having an edge in these areas. The code used in this study is publicly available on a GitHub repository for further exploration. Like Related Posts Salesforce OEM AppExchange Expanding its reach beyond CRM, Salesforce.com has launched a new service called AppExchange OEM Edition, aimed at non-CRM service providers. Read more The Salesforce Story In Marc Benioff’s own words How did salesforce.com grow from a start up in a rented apartment into the world’s Read more Salesforce Jigsaw Salesforce.com, a prominent figure in cloud computing, has finalized a deal to acquire Jigsaw, a wiki-style business contact database, for Read more Health Cloud Brings Healthcare Transformation Following swiftly after last week’s successful launch of Financial Services Cloud, Salesforce has announced the second installment in its series Read more

Read More
Sales Pipeline

Salesforce Pipeline Forecasting Tools

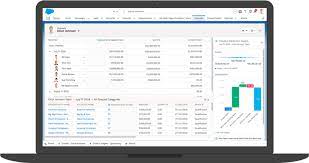
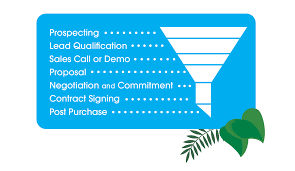
Does Salesforce offer forecasting capabilities? Salesforce Pipeline Forecasting Tools. Indeed, Salesforce provides a robust suite of customizable forecasting tools, revolutionizing strategic planning by infusing data-driven insights into decision-making processes, moving away from reliance on intuition or guesswork. Salesforce Collaborative Forecasting empowers sales leaders with visibility into future sales bookings or revenue. Real-life success stories from companies like Pure Storage and Nitro underscore the tangible benefits of leveraging forecasting within Salesforce. This feature supports matrix sales organizations by tracking revenue splits or overlays and offers the flexibility of forecasting by custom fields. What is pipeline forecast management in Salesforce and Salesforce Pipeline Forecasting Tools? Pipeline management encompasses the active oversight of all sales opportunities as they progress through a multi-step sales cycle towards a successful close. Salesforce’s forecasting features, including Collaborative Forecasting, address the challenge of obtaining accurate forecasts by leveraging abundant data and reporting tools. This ensures a comprehensive understanding of opportunities in the pipeline and facilitates strategies to advance deals. Why is forecasting important in Salesforce? Sales forecasts in Salesforce play a critical role in anticipating potential challenges before they materialize, allowing ample time for preparation and risk mitigation. This proactive approach enables businesses to navigate hurdles effectively. Salesforce Forecasting is strategic planning, demand planning, and revenue forecasting software that harnesses collaborative data for precise future projections. The customizable software enables businesses to base strategic planning on empirical data rather than conjecture. The Collaborative Forecast feature in Salesforce Sales Cloud provides real-time views of team forecasts, supporting automatic roll-ups, quota attainment visibility, collaboration, and various forecast types. Salesforce Sales Cloud offers two methods for forecasting: non-cumulative and cumulative. Non-cumulative forecasting reports closed, committed, best case, and pipeline numbers separately, while Cumulative Forecast provides more comprehensive data aggregation across forecast categories, including closed, committed, best case, and open pipeline. Sales forecasting, a technique for predicting expected sales revenue, relies on a company’s historical data. Salesforce forecasting tools facilitate this process by providing robust analytical capabilities. What are the Salesforce forecasting stages? Forecast Category groups opportunities within the sales cycle based on their stage. Standard forecast categories include Pipeline, Best Case, Commit, Omitted, and Closed. What is the difference between forecasting and pipeline in Salesforce? While pipeline management focuses on advancing opportunities through the purchasing process, forecasting predicts future sales from a segment of the pipeline. Is Tableau a forecasting tool? Yes, Tableau Desktop offers forecasting capabilities for quantitative time-series data using exponential smoothing models, capturing evolving trends and seasonality effectively. What is the difference between pipeline and workflow? Pipelines govern the end-to-end flow of items through stages, while workflows manage status changes throughout an item‘s lifecycle. What is the difference between pipeline and funnel in Salesforce? A pipeline represents the sales rep’s perspective and process for closing deals, whereas the funnel illustrates the customer’s buyer journey phases. Is forecasting a KPI? Absolutely, revenue forecasting accuracy serves as a fundamental Key Performance Indicator (KPI), comparing forecasted revenue with actual revenue for a given period to gauge performance effectively. Like1 Related Posts 50 Advantages of Salesforce Sales Cloud According to the Salesforce 2017 State of Service report, 85% of executives with service oversight identify customer service as a Read more How Travel Companies Are Using Big Data and Analytics In today’s hyper-competitive business world, travel and hospitality consumers have more choices than ever before. With hundreds of hotel chains Read more Marketing Cloud Account Engagement and Salesforce Campaigns The interplay between Account Engagement and Salesforce Campaigns often sparks confusion and frustration among users. In this insight, we’ll demystify Read more Integration of Salesforce Sales Cloud to Google Analytics 360 Announced In November 2017, Google unveiled a groundbreaking partnership with Salesforce, outlining their commitment to develop innovative integrations between Google Analytics Read more

Read More
Salesforce

Better Data Better Forecasting

Sales forecasts, much like weather forecasts, serve as crucial tools for planning ahead, yet their effectiveness hinges on accurate data. A Gartner report reveals that only 45% of sales leaders express confidence in the accuracy of their organizations’ sales forecasts. Better data better forecasting. It makes sense, right? Nobody wants the weather man to forget to tell them to pack an umbrella any more than they want their data to leave out key engagement or conversion information. Data-driven Culture At Salesforce, fostering a data-driven culture has been instrumental in achieving consistent and precise forecasts. The entire Salesforce sales organization actively contributes to maintaining this culture, offering valuable insights into how similar success can be achieved in any company, driven by accurate Salesforce forecasting. A forecast is a prediction made by studying historical data and past patterns. Businesses use software tools and systems to analyze large amounts of data collected over a long period of time. Salesforce tools can help you do this effectively. Open Access to Data for Everyone: Collective Accountability for Data Maintenance: Yan Pu, Vice President of Sales Operations and Strategy at Salesforce, emphasizes that everyone, despite having different job descriptions, works collaboratively to keep data updated. This shared responsibility is crucial to the efficiency and accuracy of forecast reviews, preventing reliance on stale data. Better Data Better Forecasting In the business world of data and forecasting, accuracy is paramount. Salesforce, coupled with a unified source of truth for data, emerges as a valuable tool. Data accuracy drives the field of data analysis. Tectonic, as your Salesforce implementation partner, ensures the development of a tailored Salesforce solution. Aligned with your business needs and incorporating essential elements and omitting unnecessary components. As a Salesforce Consulting Partner based in Colorado, Tectonic brings together a skilled team of certified professionals, specializing in crafting innovative solutions across various Salesforce products to enhance your business operations. Like Related Posts Salesforce OEM AppExchange Expanding its reach beyond CRM, Salesforce.com has launched a new service called AppExchange OEM Edition, aimed at non-CRM service providers. Read more The Salesforce Story In Marc Benioff’s own words How did salesforce.com grow from a start up in a rented apartment into the world’s Read more Salesforce Jigsaw Salesforce.com, a prominent figure in cloud computing, has finalized a deal to acquire Jigsaw, a wiki-style business contact database, for Read more Health Cloud Brings Healthcare Transformation Following swiftly after last week’s successful launch of Financial Services Cloud, Salesforce has announced the second installment in its series Read more

Read More
gettectonic.com