Building a Sales Forecast Report in Power BI: Portfolio Project
Sales forecasting is essential for businesses to estimate future sales and revenues, allowing them to make data-driven decisions on inventory, hiring, marketing, and other critical functions. This guide outlines the process of creating a sales forecasting report in Power BI using a sample dataset from the internet.
Data Preparation
The dataset used contains transaction data, including order dates, products, quantities, and sales amounts from 2019 to 2021. Before importing the data into Power BI, it required several preparation steps in Excel:
- Cleaned column formats and removed any blank columns.
- Replaced #N/A values with 0 as a special case.
- Replaced placeholder values and formatted columns as dates and times.
- Checked the values in each column to identify any data representation errors.
- Created a new column for delivery time by calculating the difference between order and delivery dates.
Key fields prepared for analysis included:
- Order Date (split by Year and Month)
- Customer Name
- Product Category
- Sales Amount
- Quantity Sold
- Profit Margin
- Average Delivery Time (days)
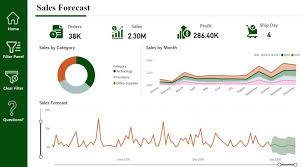
Visualizing Sales Trends
Once the optimized dataset was imported into Power BI, the report development began with visuals to analyze trends:
- Sales Over Time: A line chart visualized total monthly sales, providing insights into seasonality and overall growth trends.
- Sales by Category: A stacked bar chart broke down revenue by product categories, identifying top revenue drivers.
- Sales Metrics: Key performance indicators (KPIs) like revenue, profit, and total units sold were displayed on cards, useful for quick reference.
- Ranking Tables: Tables highlighting top-performing products and regions provided detailed insights.
These visuals were organized into a clean, intuitive layout with formatted legends, axes, and labels for clarity. The report page on historical sales trends included the following key visualizations:
- Total Sales by Year: A line chart showing a 35% increase in sales from 2019 to 2021.
- Sales by Product Category: A stacked bar chart illustrating the revenue breakdown by product segment.
- Sales Metrics: Cards displaying KPIs such as revenue, profits, and units sold, providing quick snapshots.
- Top Customers: A table listing customers with the highest sales, helpful for profiling.
The visuals provided a comprehensive view of historical sales patterns.
Forecasting Model
To predict future sales, a time series forecasting model was created in Power BI. The model used past sales data to predict sales for the next 15 days. Visuals were included to compare forecasts with actual sales, and the results closely aligned with historical trends.
Key Insights
The forecasting model revealed several valuable insights that could drive data-based decision-making:
- A predicted 10% increase in sales for 2022 compared to 2021.
- Growth driven primarily by Furniture and Office Supplies categories.
- Q4 holiday sales expected to peak as usual in October and December.
- Online sales have grown faster than in-store sales over three years, indicating a shift in customer preferences.
- The Central region is the highest-performing area, while the East region has seen a decline, highlighting areas for potential marketing focus.
- Laptops have overtaken printers as the top-selling technology product, informing product portfolio adjustments.
- Phones and chairs have seen increased sales, likely due to the pandemic.
- Sales of folding chairs spiked in 2020, likely reflecting changing consumer needs due to the pandemic.
Conclusion
Accurate sales forecasting supports smarter planning and resource allocation. This Power BI report serves as a template for analyzing real sales data and creating forecasts to support business growth. The insights derived from these forecasts empower organizations to make strategic decisions regarding inventory, marketing, and operations.
Who is Salesforce? Here is their story in their own words. From our inception, we've proudly embraced the identity of Read more

Salesforce Marketing Cloud Transactional Emails are immediate, automated, non-promotional messages crucial to business operations and customer satisfaction, such as order Read more

Salesforce has unveiled a comprehensive analytics solution tailored for wealth managers, home office professionals, and retail bankers, merging its Financial Read more
AI plays a crucial role in propensity score estimation as it can discern underlying patterns between treatments and confounding variables Read more