Mastering Salesforce Bucket Columns: Smarter Data Grouping for Sales Ops
The Reporting Challenge in Salesforce
Salesforce reporting helps Sales Operations teams analyze data—but large datasets in table format can quickly become overwhelming.
Example: You need to sort Accounts by employee count to focus on “Medium-sized” targets. Without smart grouping, you’re stuck manually sifting through rows—wasting time and missing insights.
Solution? The Bucket Column (or Bucket Field)—a powerful Salesforce feature that organizes data into meaningful categories for faster decision-making.
What is a Salesforce Bucket Column?
A Bucket Column groups raw data into custom-labeled ranges directly in reports—no coding or complex formulas required.
Limitations to Know
⚠ Only 5 bucket fields per report
⚠ Max of 20 buckets per field
⚠ Requires “Create and Customize Reports” permissions
How to Create a Bucket Column (Step-by-Step)
Scenario: Group Accounts by employee count (e.g., Small, Medium, Large).
- Edit your report (e.g., an Accounts report).
- Select the column to bucket (e.g., “Employee Count”).
- Click the dropdown → “Bucket This Column.”
- Define ranges & labels:
- Bucket Name (e.g., “Account Size”)
- Ranges (e.g., 1-100 = “Small,” 101-1000 = “Medium”)
- Click “Add” for more buckets.
- Apply → Your data is now grouped!
Pro Tip: Use “Show Unique Count” to see how many values fall into each bucket.
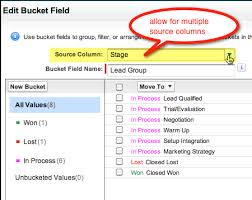
Advanced Bucket Column Features
1. Edit Buckets on the Fly
Need adjustments? Click “Edit Bucket Column” to tweak ranges or labels anytime.
2. Group Rows by Bucket
- In Edit Mode, select “Group Rows By This Field”
- Instantly collapse/expand sections (e.g., “Medium Accounts”)
3. Filter by Bucket
Focus on specific segments—like only “Large” Accounts—with a single filter.
When to Use Bucket Columns vs. Alternatives
Bucket Columns are great for quick in-report grouping, but for complex analytics, consider:
🔹 Coefficient – Sync live Salesforce data to Google Sheets/Excel for unlimited reporting flexibility.
🔹 Custom Dashboards – Blend Salesforce data with other sources (ERP, marketing tools).
🔹 Einstein Analytics – AI-driven insights for large datasets.
Bonus: Tools like Coefficient let you share reports without extra Salesforce licenses and automate Slack/email alerts.
Key Takeaways
✔ Bucket Columns = faster insights – Turn raw data into actionable segments.
✔ No-code solution – Business users can self-serve without IT help.
✔ Best for simple grouping – For advanced analytics, explore integrations.
Next Step: Try bucketing your next Salesforce report—or pull data into Sheets/Excel for even deeper analysis!
Need help with Salesforce reporting? Contact Tectonic today!
Content updated April 2025.
Who is Salesforce? Here is their story in their own words. From our inception, we've proudly embraced the identity of Read more
Salesforce Marketing Cloud Transactional Emails are immediate, automated, non-promotional messages crucial to business operations and customer satisfaction, such as order Read more

Salesforce has unveiled a comprehensive analytics solution tailored for wealth managers, home office professionals, and retail bankers, merging its Financial Read more
AI plays a crucial role in propensity score estimation as it can discern underlying patterns between treatments and confounding variables Read more